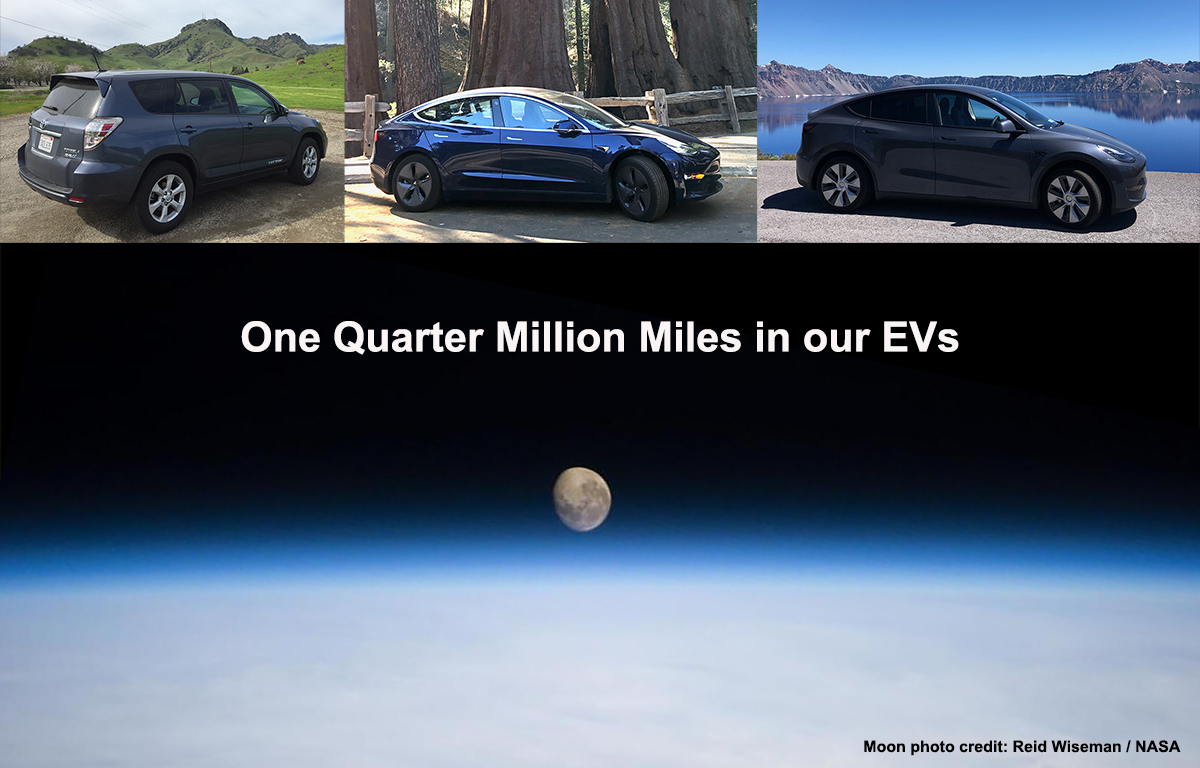
From 2013 to 2018 our family transitioned from two gas-powered cars to two battery-powered EVs. Since 2013 we’ve driven a quarter million miles in our EVs – that’s 250,000 electric miles over the past 12 years. Here’s a quick breakdown on how we use our EVs, money saved, and reduced emissions.
We drive 39 miles a day. We are pretty much average drivers for the US, logging about 39 miles a day in our EVs. Again, these are average numbers.
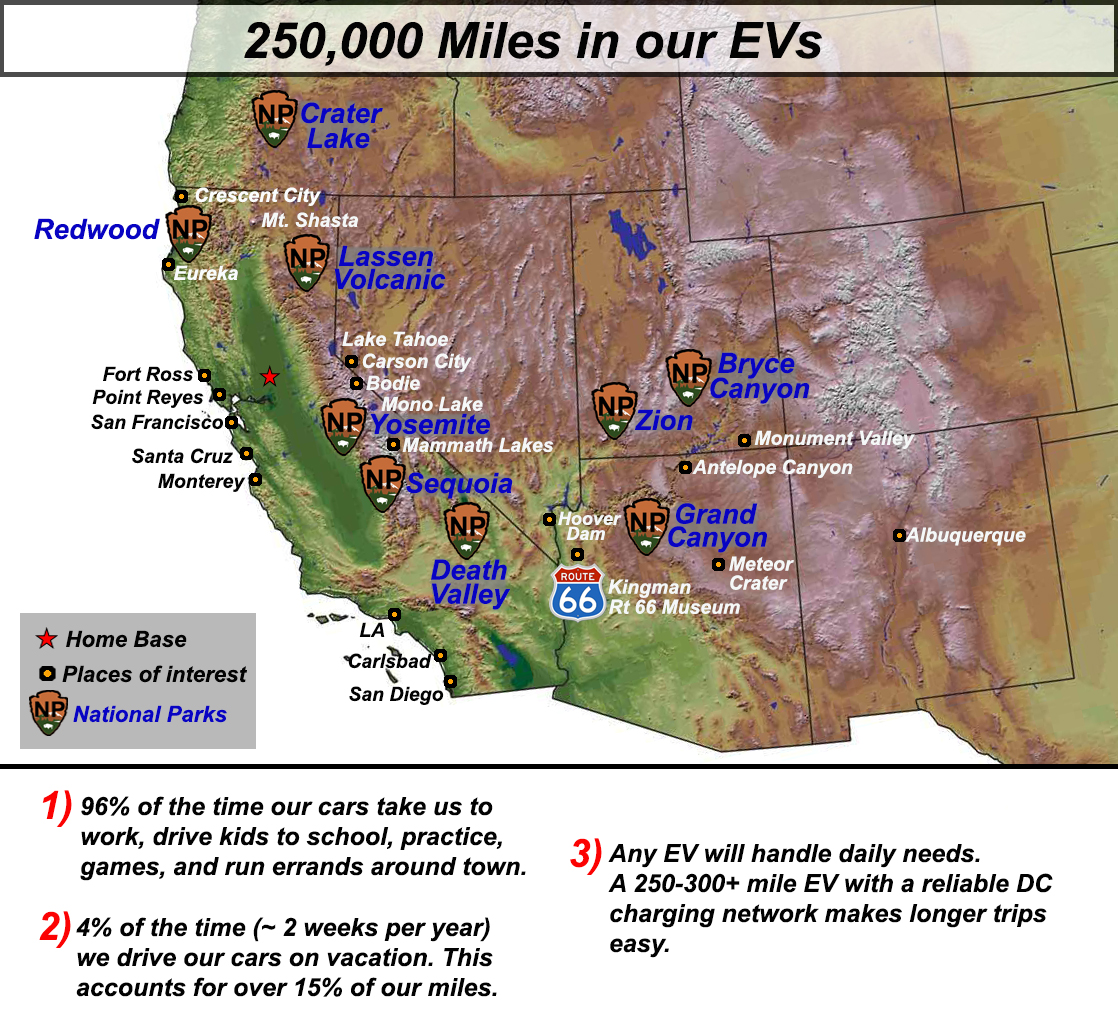
96% of the time we drive locally. The bulk of our driving is commuting to work, driving the kids to school / practice / games, and driving around town for chores. These trips take up 96% of our driving time.
4% of the time we drive our cars on vacations. About 2 weeks each year we drive our cars on summer vacations and long weekends out of town. This represents only 4% of our time, but adds up to more than 15% of our mileage.
Our EVs take us to memorable places. Out of town trips included visits to National Parks, state parks, campgrounds, drives along the California coast, countless trips to the Bay Area, and other places of interest throughout California, Oregon, Nevada, Arizona, Utah, and New Mexico. We haven’t yet gone cross country in our EVs, but we get around a bit.
EVs don’t restrict travel. A reliable and rapid DC charging network has allowed us to go to all of the places we’ve wanted to visit without cramping our style. Charging an EV doesn’t slow you down. 15-20 minute charging stops every 150-200 miles gives us a chance to stretch our legs, get a drink, a bite to eat, and have the kids burn off some energy. We’ve driven over 800 miles a day with kids and without problems.
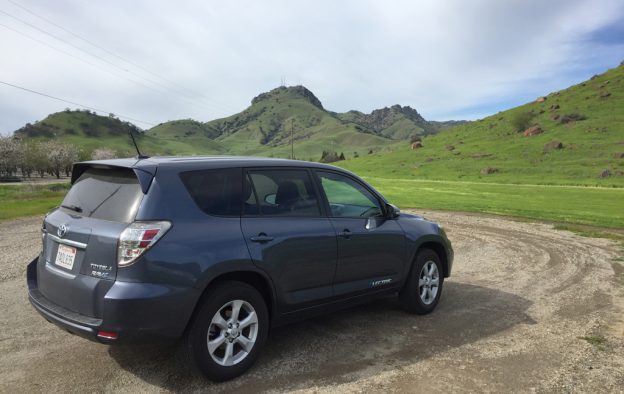
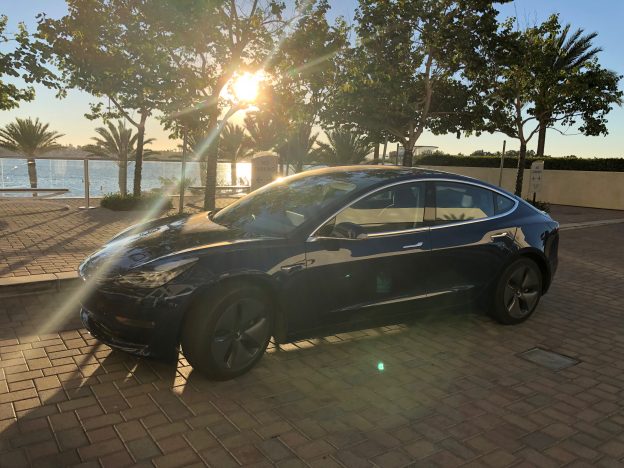
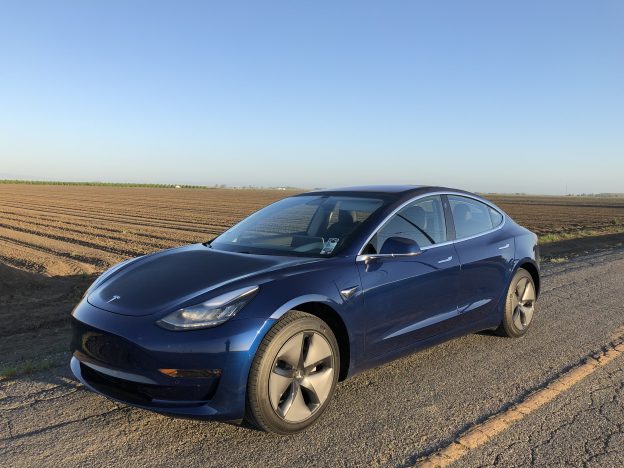
We saved money on fueling costs. We traded in a Toyota Corolla for the Rav4 EV in 2013, traded our Toyota Prius for a Model 3 in 2018, and then replaced the Rav with a Model Y in 2020. The combination of switching to cheaper electricity to power more efficient vehicles, and installing rooftop solar saved us money.
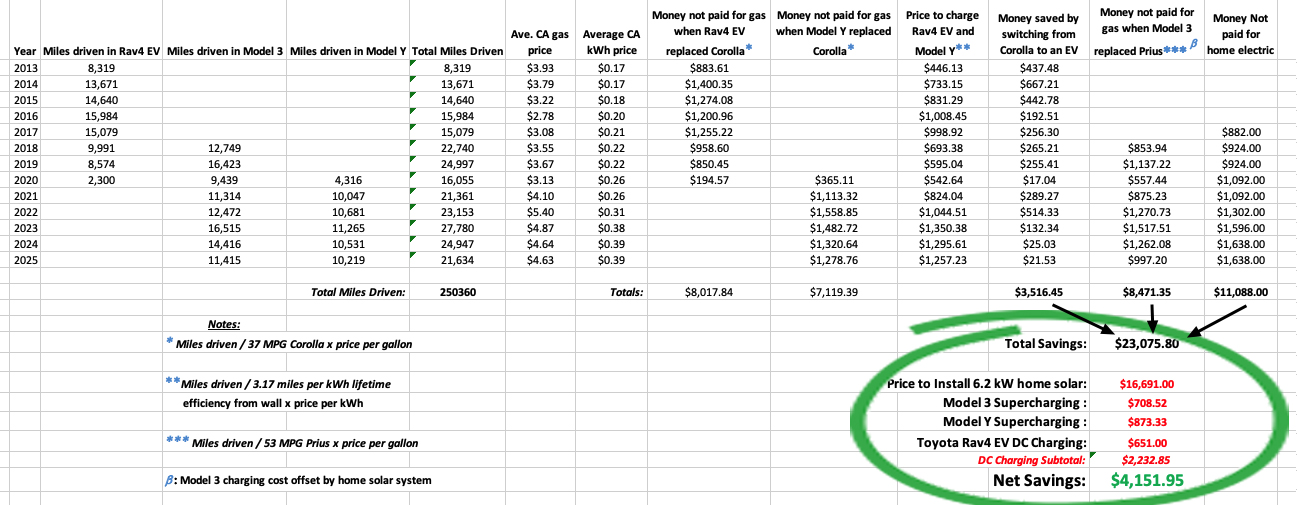
Money in the bank.
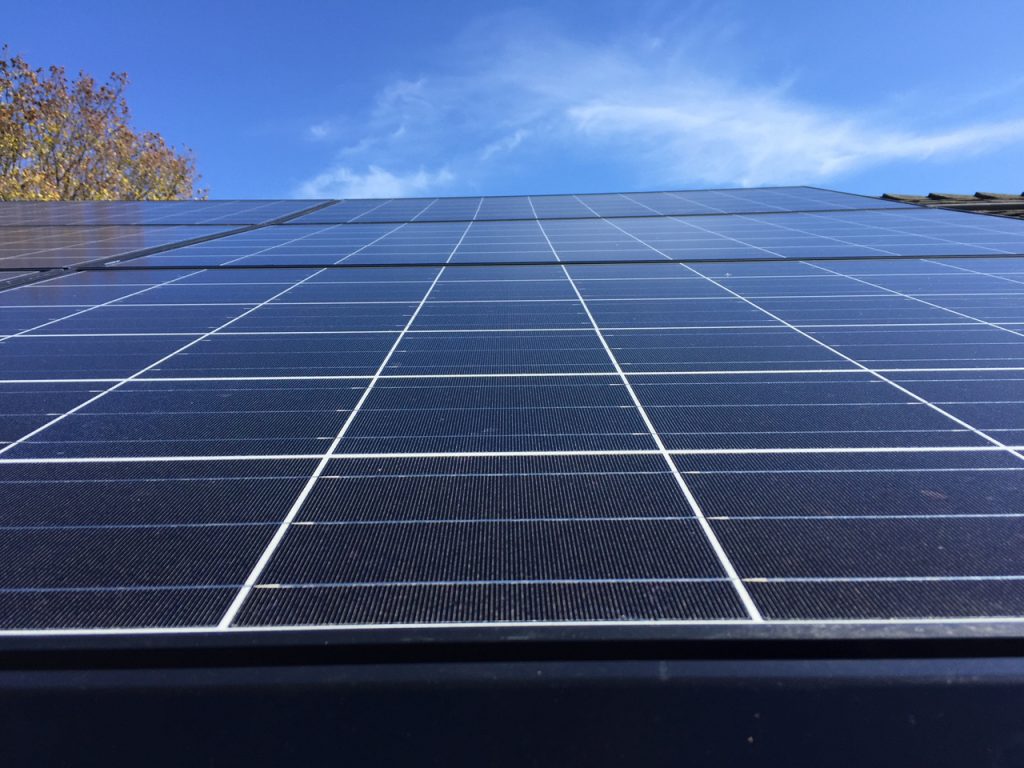
Rooftop solar offsets our electricity use and saves money. In 2017 we paid $16,700 to install a 6.2 kW rooftop solar power system. This was kind of like prepaying for gas, but way better. Our rooftop system offsets all of the electricity we use for our home and for charging one EV. The money we saved by 1) not buying gas; 2) powering our cars with electricity since 2013; and 3) not paying for home electricity since 2017 = $23,000. Subtract the cost of installing solar, and the cost of charging our cars on road trips and we have net savings of $4,100 over 12 years.
Rooftop solar offsets your electricity use and helps power the grid.
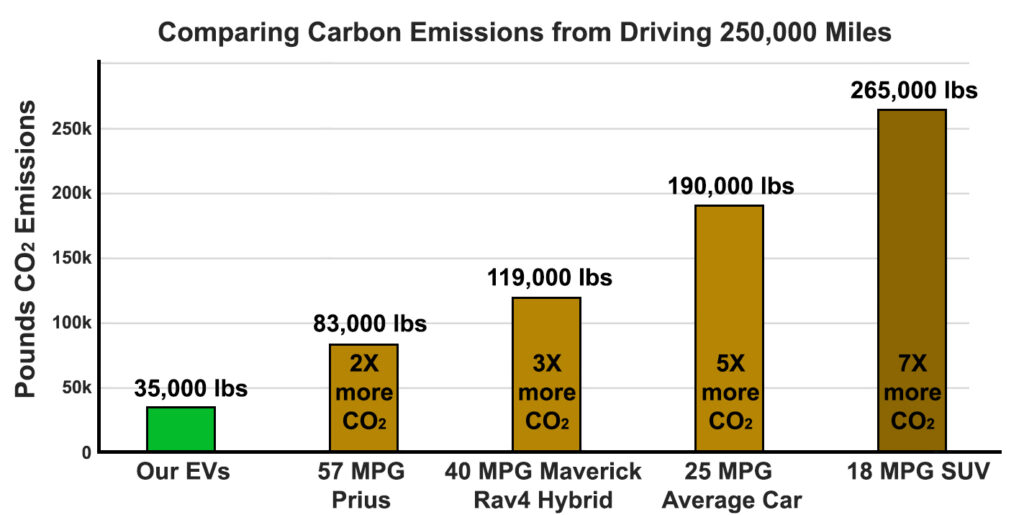
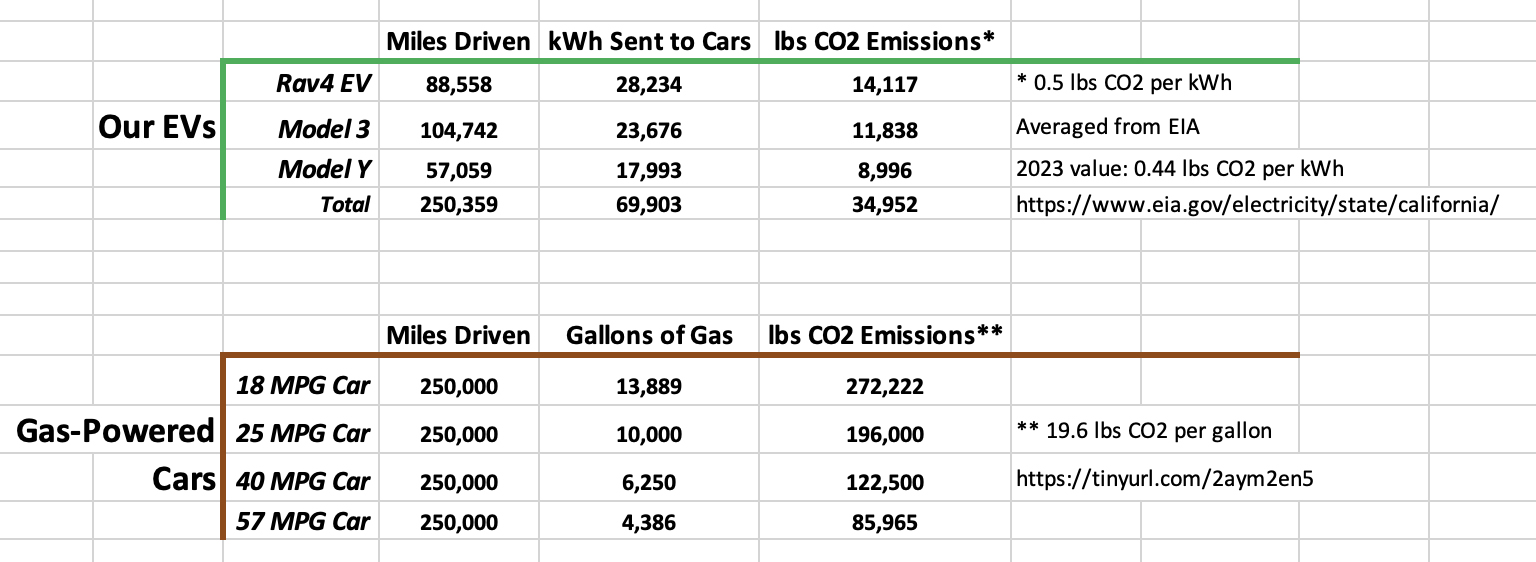
EVs reduce CO2 emissions. The graph below demonstrates the large difference in emissions produced by driving 250,000 miles in gas powered cars compared to our EVs. A large SUV releases over 1 pound of CO2 into the atmosphere for every mile driven. In contrast, our EVs released 0.14 pounds per mile driven. Over 12 years we reduced our carbon emissions from driving EVs by nearly 100,000 lbs compared to the gas-powered cars we used to drive – and over 200,000 lbs compared to large SUVs. The reduced emissions from just one family would be even more significant if applied to a large portion of cars on the road in the US (almost 300 million).1
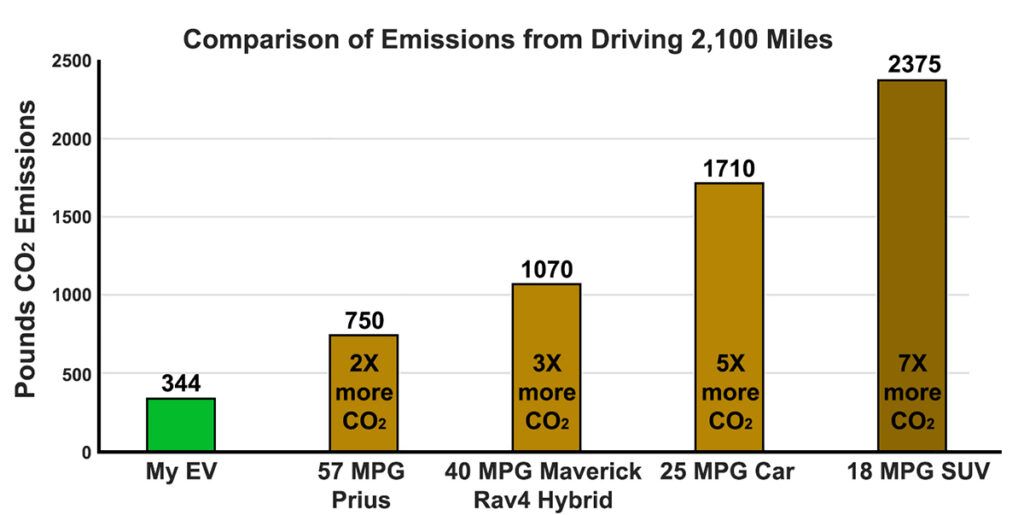
The fuel efficient 57 MPG Prius releases over 2X more CO2 into the atmosphere than our EV. The 40 MPG hybrid drivetrain versions of the Toyota Rav4 and Ford Maverick release 3X more and a large SUV releases 7X more CO2 into the atmosphere.
Carry that weight. Here’s another way of thinking about the pollution we make by driving. Imagine if you had to carry the weight of CO2 you produce from daily driving. Each day the average person in the US drives about 35 miles. A large 18 MPG SUV releases over 1 pound of CO2 per mile, which adds up to 38+ pounds. In contrast, our EVs release less than 5 pounds of CO2 per day. 38 pounds may not sound huge, but imagine carrying that weight in a backpack all day long, for every day you drive. That weight on your back is what large gas-powered vehicles pump into the atmosphere every day.
Note that five pounds of carbon emissions per day from an EV is not zero, but it’s an improvement. Increasing renewable sources to power our grid will drive that number down even lower.
Final point. The CO2 we pump into the atmosphere doesn’t just float away. The atmosphere is large but finite. In the US we pump several billion pounds of CO2 into the atmosphere every day just from personal transportation. We can change that.
It’s fall of 2025, but every day is Earth Day.
Footnotes:
– For calculating emissions data from our EVs, I kept track of how many kWh our EVs report using from the battery pack, how much electricity was required to get those kWhs into the pack, and CO2 emissions from generating electricity in the states where we’ve charged our cars – most of our charging was done in CA. The Department of Energy’s Energy Information Administration publishes emissions data as pounds of CO2 emissions released per MWh of electricity generated in each state. The EIA lists the data by state, by year, and includes other emissions produced by electricity generation like sulfur dioxide and nitrogen oxide. I focused on CO2 since it is a potent heat trapping gas, and is useful for comparing EV emissions with those from gas powered cars. – Calculating CO2 emissions from gas powered cars is easy since each gallon of gas burned releases 19.6 pounds of CO2, so miles driven divided by MPG = gallons of gas burned. ↩︎
This spring I reached 7 years and 100,000 miles in my Model 3 and celebrated the occasion with a road trip to visit National Parks and landmarks in the American Southwest. I went on similar trips when the car was new, and several times a year go on regional trips that require a supercharging stop. But now with 100,000 miles on the odometer, I wanted to know how well the car would handle a longer trip. Would I still get fast DC charging speeds while driving hundreds of miles and supercharging 2 or 3 times per day? Would I have to wait in line to charge since more cars use the Supercharging network now? Would newer charging stations be in good locations? And what about that electric cooler I picked up, would it drain my battery (kidding)? My goal was to combine an EV road trip with meeting friends from the east coast, spending time in the great outdoors, and testing whether my 7-year-old EV was still road trip worthy.
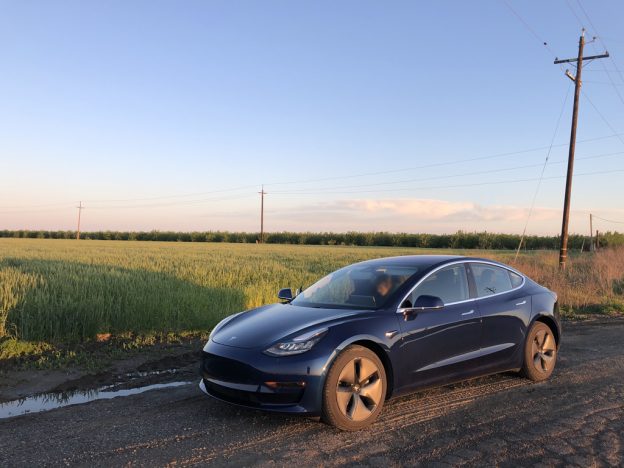
The Car
2018 Model 3, RWD, 18″ wheels. The odometer is now at 102,000 miles and rated range with a full charge is 272 miles. Note that rated range is based on an EPA estimate of energy use per mile. Over 100k miles I average 15-20% over EPA rating with this car, but as always YMMV.
The Trip
Visiting National Parks. This was a milestone birthday celebration with a group of friends to hike, bike, and kayak in National Parks in Arizona and Utah. My east coast friends flew in to Phoenix and drove to the Grand Canyon. One friend drove with me from the Sacramento area and we stopped at a few more National Parks and landmarks along the way. We took turns driving and my friend served as DJ. Somehow I’d missed the whole Yatch Rock thing and it set the perfect vibe for this road trip. Also, Ray Parker Jr. and Raydio – 2 thumbs up (Your Music May Vary).
National Parks and Landmarks Visited
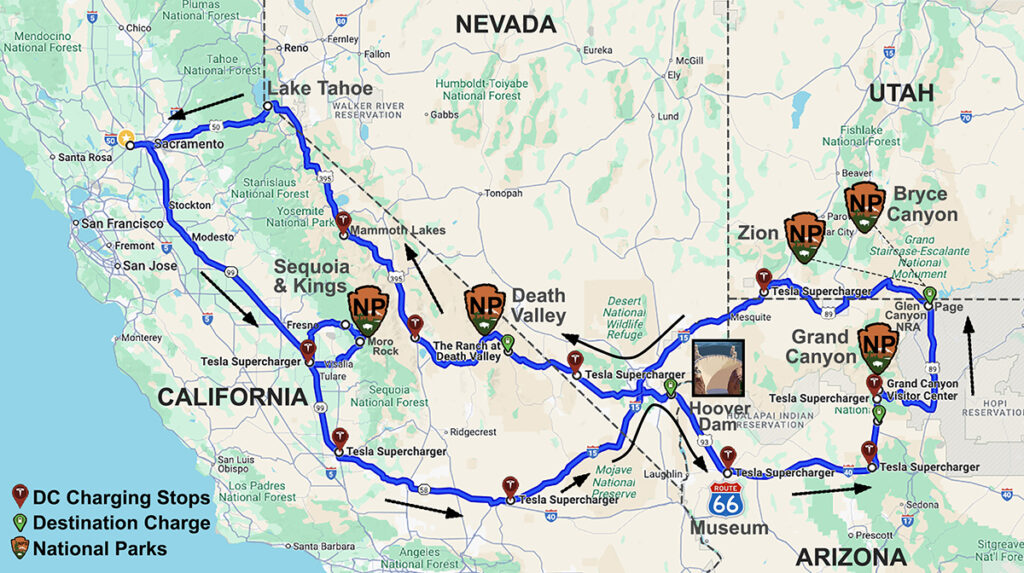
This trip totaled over 2,100 miles. We stopped at Sequoia & Kings Canyon National Park to check out Moro Rock and giant sequoias; the Hoover Dam; the Route 66 Museum in Kingman; hiked in the Grand Canyon; kayaked on the Colorado River in the Glen Canyon National Recreation Area; rented eBikes in Zion National Park; hiked in Bryce Canyon National Park; walked through slot canyons near Page; checked the temperature in Death Valley (it was hot); and stopped at Mammoth Lakes, Mono Lake, and Lake Tahoe.
Supercharging
Supercharging stops averaged 18 minutes for the whole trip. I supercharged 11 times at 10 locations and my car charged the same on this road trip as before. I noticed charging power over 220 kW, but didn’t stick around to check the highest charging speed. I averaged 148 miles between superchargers. I also used overnight destination charging at 3 places we stayed during the trip.
I paid $163 for charging on this trip.
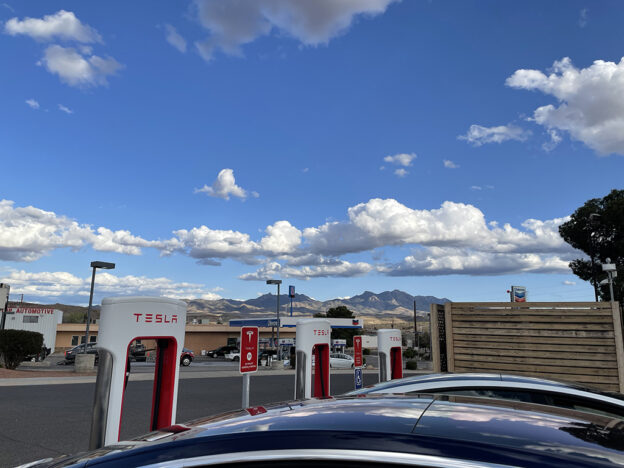
I didn’t have to wait in line for superchargers. The superchargers were busy but no waiting. I saw cars from different manufacturers at most stops and that was good to see. However, twice I saw a single car taking up 2 supercharger stalls because their charging port was on the opposite side of the car and parking like that was the only way the driver could get close enough to plug in. Luckily that didn’t prevent anyone else from charging those times. Tesla’s new v4 Superchargers have a longer cord that solves this problem.
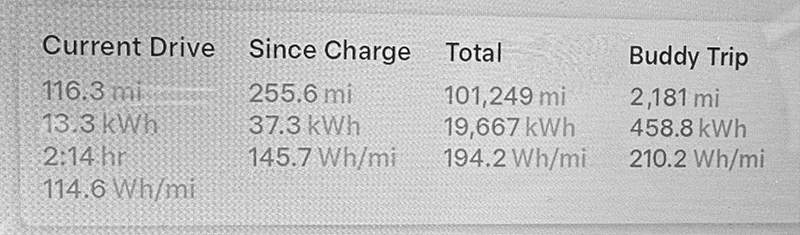
Phone pic of my odometer. We drove 2,100+ miles while visiting National Parks and landmarks in 4 states.
Energy Use
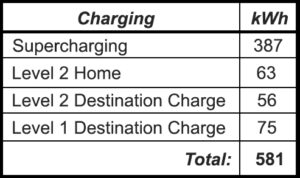
I used 581 kWh of electricity to drive 2,181 miles. The car reported using about 460 kWh for the trip (see odometer above under ‘Buddy Trip’). But that number represents only energy used from the battery pack. Getting those 460 kWh into the pack used more energy. Charging an EV involves converting AC to DC, which results in losses. Supercharger stations convert electricity to DC before sending it to an EV – a process that is about 92% efficient. As a result, 100 kWh of electricity are used for each 92 kWh sent to an EV. Level 2 conversion of AC to DC occurs in your car and is less efficient – about 85%. So 100 kWh are used for each 85 kWh stored in the pack. Level 1 charging is less efficient – about 70%. I recorded energy sent to my car on this trip from Supercharging, Level 2 charging, and Level 1 charging, and added charging losses to get a more accurate estimate of the total amount of energy used.
2/3 of the energy for this trip came from supercharging.
Two thirds of my energy came from supercharging. The rest came from overnight Level 1 and 2 destination charging at places we stayed, and the initial charge at my home.
Comparison: 1 gallon of gas contains the same amount of energy as 33.7 kWh of electricity. So using 581 kWh of electricity for this trip is like using 17 gallons of gas to drive 2,100 miles (that’s like getting 125 MPG).
Emissions
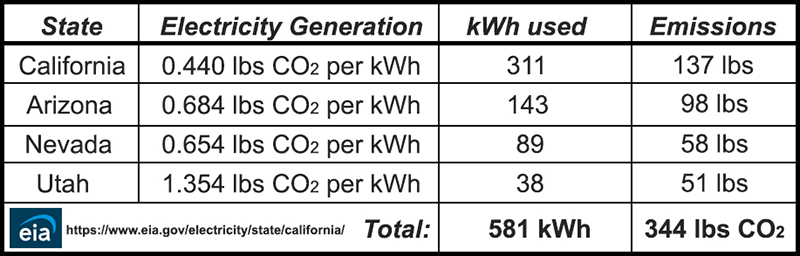
Charging my car produced 344 lbs of CO2 emissions. Where you charge on a multi-state road trip impacts total emissions since each state utilizes a different mix of fossil fuels and renewable power plants for their grid. I kept track of how much electricity I got from charging in each state and looked up CO2 emissions from generating electricity in those states. The Department of Energy’s Energy Information Administration publishes this data as pounds of CO2 emissions released per MWh of electricity generated in each state. The EIA lists the data by state, by year, and includes other emissions produced by electricity generation like sulfur dioxide and nitrogen oxide. I focused on CO2 since it is a potent heat trapping gas, and is useful for comparing EV emissions with those from gas powered cars.
Note: Within each state, emissions vary by region, by season, and throughout the day. The value of CO2 emissions per kWh listed for each state is an annual average from the most recent year published – 2023.
In summary, I drove 2,181 miles and used 581 kWh of electricity. Generating electricity in California, Arizona, Nevada, and Utah to charge my car released 344 lbs of CO2.
How Does This Compare to a Gas Powered Car?
The average 25 MPG car produces 5 times more CO2 than my EV. Calculating emissions from gas powered cars is much simpler. Burning one gallon of gas releases 19.6 lbs of CO2. So you just need to know the number of gallons of gas used. The average car in the US gets 25 MPG. So a 25 MPG car traveling 2,181 miles would burn 87 gallons of gas and release 1,710 lbs of CO2 into the atmosphere – 5X more than my EV. I also calculated emissions from more efficient cars and larger less efficient SUVs that are popular (see below).
EVs produce fewer emissions.
Why is This Important?
Transportation accounts for nearly 1/3 of carbon emissions in the US. There’s about 300 million vehicles on the road in the US, and hundreds of millions more around the world. The average person in the US drives about 13,000 miles per year in a car that gets 25 MPG. New sedans are more efficient, but pickup trucks and SUVs are the most popular vehicles on the road and these vehicles lag behind in efficiency. Even with improved efficiency for gas burners, EVs are much better for daily driving, road trips, and over their full life cycle.
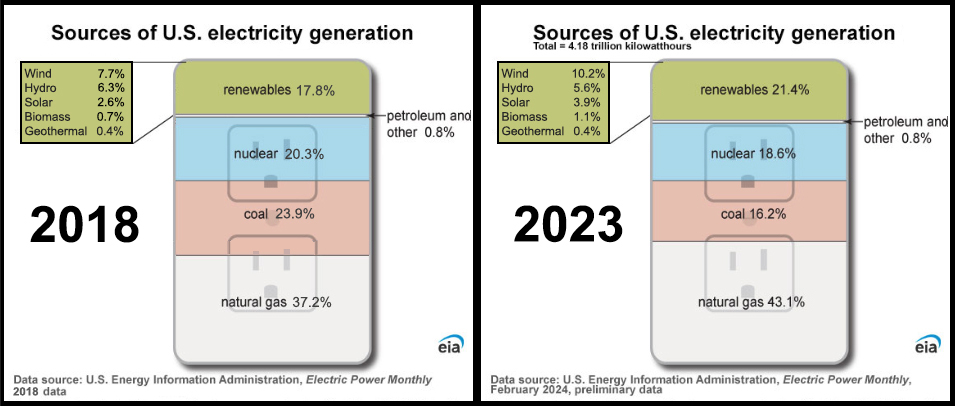
My EV makes less pollution today than it did 7 years ago because the electric grid has been getting cleaner – there has been a shift from coal to cleaner burning natural gas and an increase in the use of renewable sources for generating electricity (see below). In contrast, the efficiency of gas powered cars does not improve over time – a car that gets 25 MPG today will get 25 MPG 7 years from now.
Comparison of fuel sources for electricity generation in 2018 vs 2023. Less coal and more renewables have contributed to making the grid cleaner.
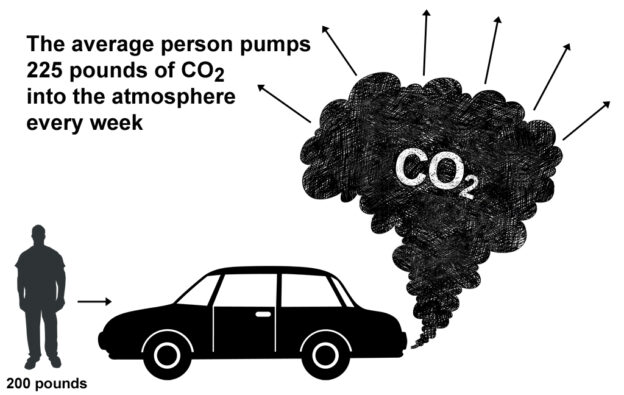
The average gas-powered car in the US releases over 200 lbs of CO2 into the atmosphere every week. Multiple that by the millions of vehicles on the road, every day, all year long, and those emissions add up quickly to 35 billion tons of CO2 injected into the atmosphere each year – by vehicles in the US. This man-made process is dramatically increasing the level of CO2 in our atmosphere.
We pump fossil fuels out of the earth and transfer that carbon into the atmosphere. Our current mode of transportation consists of pumping fossil fuels out of the earth and burning them. This takes carbon that was deposited in the earth over a period of millions of years and rapidly transfers it to the atmosphere through a 100% man-made process. The climate has gone through ice ages and warm phases in the past. However, previous climate change events were caused by natural events like prolonged volcanic activity, changes in solar activity or the Earth’s orbit, and perhaps even asteroids. Those climate changes brought drastic consequences including species extinctions that are best avoided – to put it mildly.
Climate change can be avoided. Burning fossil fuels on a large scale tips the balance of the earth’s atmosphere and ecosystems, and it is entirely under our control. More sustainable solutions are available and worth developing. The good news is that the US grid has been improving.
Thoughts on EVs from my Friend
The friend who drove along with me does not have or plan to get an EV. We took turns driving but didn’t talk much about my car during the trip – except for those WTF moments when phantom braking reared its ugly head. He spun up good tunes, enjoyed the landscapes, and observed. At the end of the trip I asked for his thoughts, the pros and cons. Here’s his report:
Pros: Pleasantly surprised by how quick the car charged at the Superchargers, by the easy access to chargers along major routes, the location of chargers, amenities, and by not having to wait for charging. Cons: Cruise control was terrible. I’ve had TACC in my past 3 cars and never had a problem with it. The phantom braking is a safety issue and it was annoying as heck.
Conclusion
There is nothing extraordinary about making this trip in an EV today. ‘Regular’ cars do this all the time, and that’s the point: EVs are cars… that produce fewer emissions. My EV has held up well. At 100,000 miles it’s reliable, takes care of commuting, chores, family outings, and remains road trip worthy. It takes me places I like to go while greatly reducing emissions. If you haven’t considered an EV yet, there are a lot of options for ~300 mile EVs in the US market from Chevy, Ford, Hyundai, Kia, Nissan, Toyota, Tesla, VW (and more expensive models from Audi, BMW, Cadillac, Lucid, Mercedes, Polestar, Porsche, Rivian, and Volvo). My advice? Check it out. Oh, and the electric cooler I got that plugs into the cigarette lighter? Worked great.
Finally,I like sharing pics so I’ll end the post with a couple highlights from the trip:
Approaching Moro Rock in Sequoia National Park (left), and a view of the park from Moro Rock.
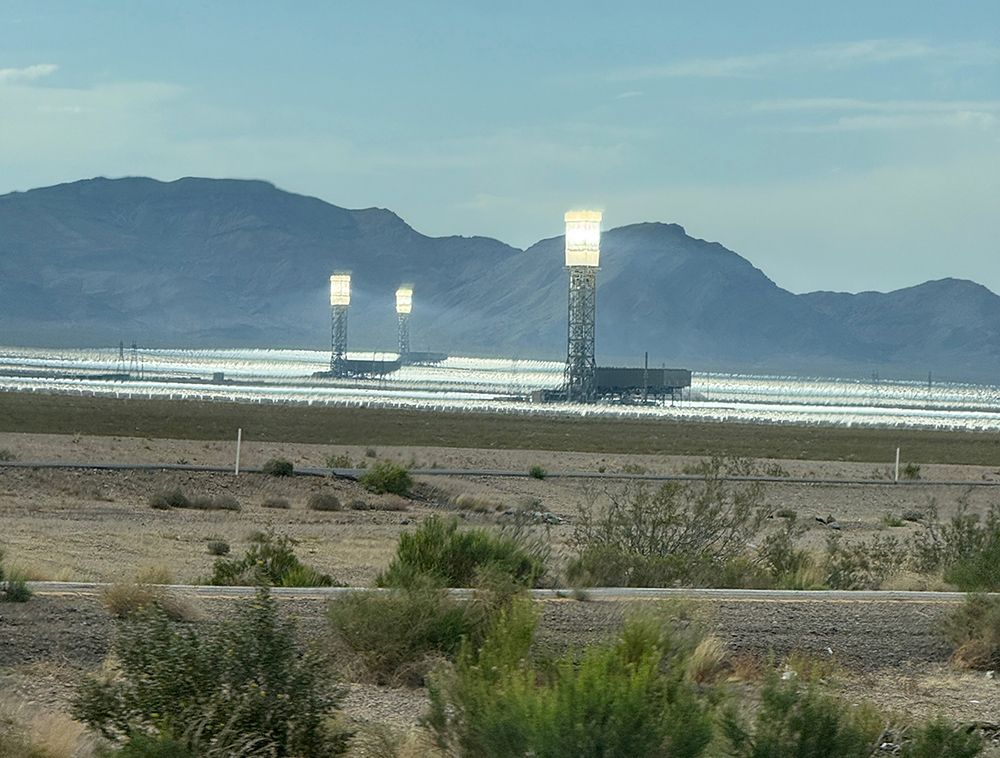
Driving past the Ivanpah power plant on Rt. 15.
Clockwise from above: Intake tower at the Hoover Dam; Statue commemorating workers who built the dam; 1951 Studebaker with a window-mounted evaporative air cooler in the Rt. 66 Museum.
The Coffee Cup Cafe in Boulder City, NV is a great little diner.
Starting our hike down South Kaibab; Coming back up Bright Angel in the Grand Canyon National Park.
Slot canyon near Page; Kayaking down the Colorado River (photo credit: Steve O).
Riding eBikes in Zion National Park; Hiking in Bryce Canyon National Park.
The author in Death Valley National Park.
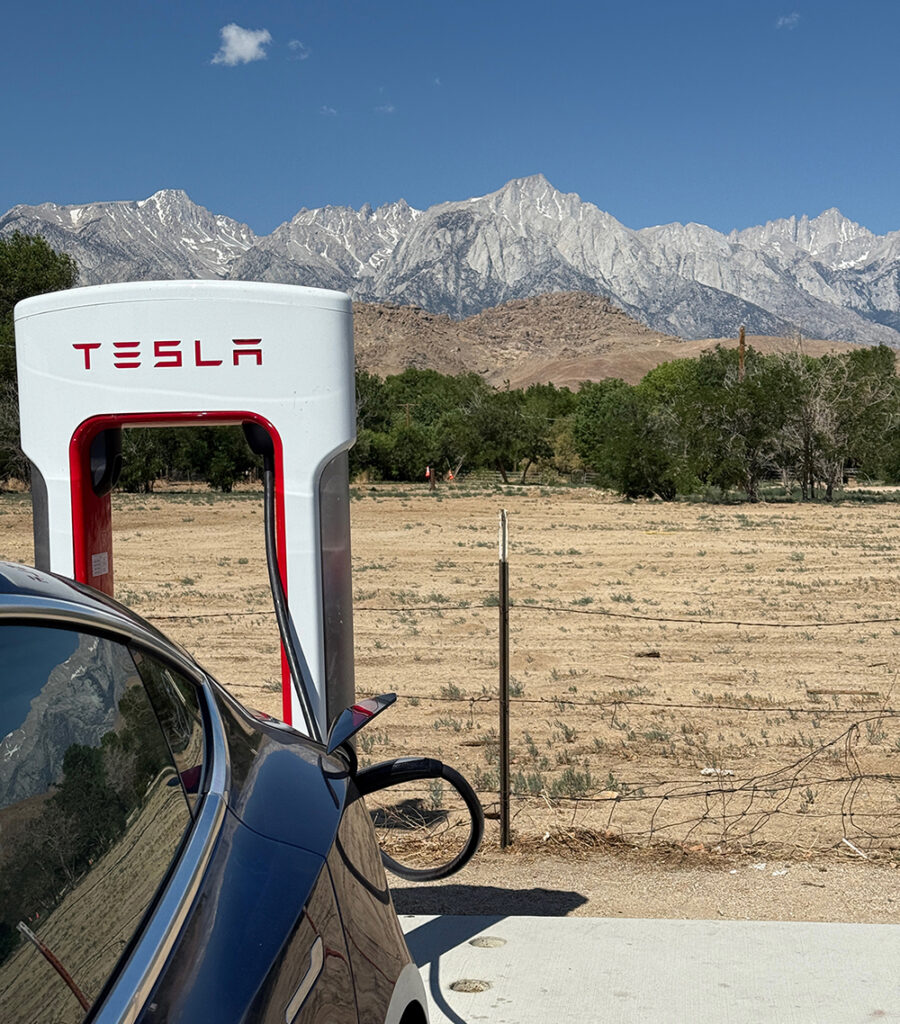
Charging in Lone Pine, CA.
If you made it this far, last point is that these are the sites you can see if you have an EV!
April 2023. California.
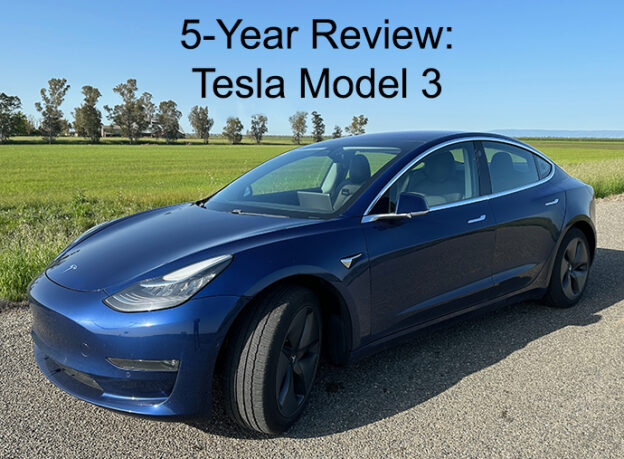
Part 6 of my 5-year review on the Model 3
We’ve just completed 5 years of driving our 2018 Model 3. This post estimates energy use and carbon emissions from charging our electric car. I calculated the amount of CO2 released from power plants to generate electricity to charge our car using data published by the US Energy Information Administration.
This post is a follow up to Supercharging II: 800 miles in a day to calculate carbon emissions from driving electric on a 1715 mile road trip. Summary: Driving an EV greatly reduced our carbon emissions to less than one quarter of a 25 MPG car.
The idea that EVs make just as much pollution as gas-powered cars is not new. It’s often brought up as a reason to keep pumping oil out of the ground and gasoline into cars. But believe me it’s an old idea, and it’s been addressed many, many times. We should, of course, all understand the mix of energy sources used to produce electricity, the emissions that come from using different sources, and the impact of emissions on the air we breath. But, the idea that EVs pollute “just as much as gas-powered cars” is not true.
Have you wondered how much of a difference it would make for the environment if you started driving electric? This year for Earth Day I analyzed our data from 15 years of driving to compare the carbon emissions produced by the gas-powered and electric cars we’ve owned.
In October 2019 I went to New Mexico for 5 days of work. The trip to Albuquerque would have been about 1200 miles as the crow flies, but rather than fly I drove there in our Model 3. The full trip was 2,700 miles through 6 states. I used 17 Superchargers and paid $92.66. Driving electric reduced my emissions by over 70% compared to driving a car that gets 25 MPG (or burns 9.7L / 100km).
One way to compare gasoline powered cars to one another is fuel economy, the miles per gallon rating that the EPA gives to each car. The average car in the United States gets about 25 MPG. So how can we compare the efficiency of electric vehicles (EVs) with gas-powered cars since EVs store electricity in the battery pack? Continue reading →


