
This post is a follow up to Supercharging II: 800 miles in a day to calculate carbon emissions from driving electric on a 1715 mile road trip. Summary: Driving an EV greatly reduced our carbon emissions to less than one quarter of a 25 MPG car.
Methods for determining carbon emissions are described below for interested readers.
Background
Electric cars are sometimes described as Zero-emission vehicles. This refers to zero-emissions from the tail pipe – and since EVs don’t have a tail pipe there are no emissions from the car as you drive. The actual emissions from driving an EV are produced by generating the electricity used to charge the EV. Emissions can be very low if you buy green energy from your utility or can charge from a roof-top solar system. Emissions can also be relatively low if you live in a region where sizable amounts of renewable energy are used to generate electricity – think hydroelectric in Washington state where 0.3 lbs of CO2 are released per kWh. Emissions can be higher if you live in a region where utilities use coal or petroleum – coal is the primary source in Wyoming where 2 lbs of CO2 are released per kWh. However, keep in mind that even if you live in Wyoming, carbon emissions from driving electric are still lower than the average car – similar to driving a 50 MPG hybrid like the Prius (Source, US EIA).
Energy Used
To calculate carbon emissions from this trip we start with energy used. A total of 488 kWh were sent to my car to charge the battery:
- 78 kWh sent to the car in my garage to start the trip (data from my utility).
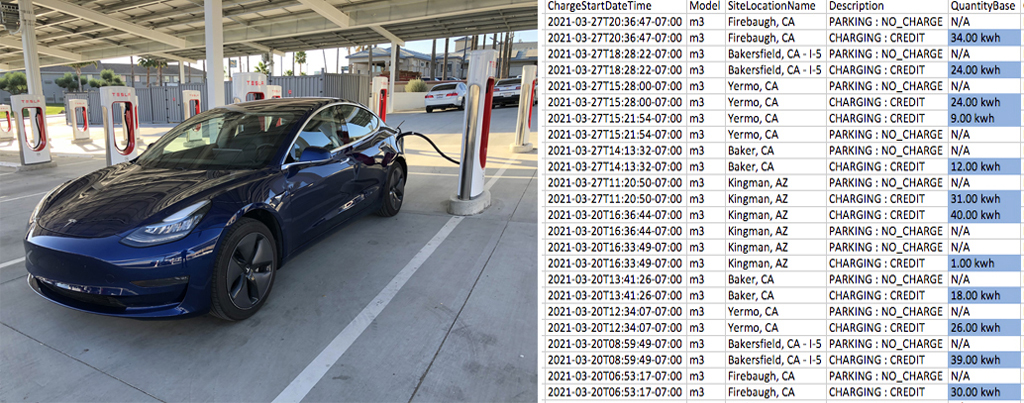
- 235 kWh were sent to our car from Superchargers in California (Tesla account provides the number of kWh sent to your car + assumed 92% efficiency at the Supercharger).
- 79 kWh sent to our car from Superchargers in Arizona (Tesla account).
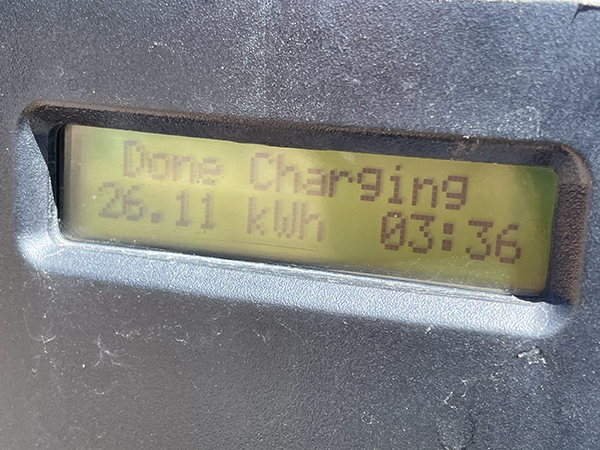
- 96 kWh sent to our car by the Level 2 charger in the Grand Canyon (charging station at Maswik Lodge reports the number of kWh sent during charging sessions).
- Total: 488 kWh sent to the car for this trip.
Of the total 488 kWh sent to our car, 313 kWh were sent to the car in California, and 175 kWh were sent to the car in Arizona.
Data Collection:
Emissions:
To calculate emissions we look at the amount of CO2 released by electric generation in CA and AZ provided by the U.S. Energy Information Administration. EIA is a division of the Department of Energy. From their website: “EIA collects, analyzes, and disseminates independent and impartial energy information to promote sound policymaking, efficient markets, and public understanding of energy and its interaction with the economy and the environment.” EIA publishes annual updates on emissions from generating electricity for each state.
2019 EIA data for lbs CO2 per kWh of electricity produced in CA and AZ:
- In California an average of 0.445 lbs of CO2 were released for each kWh of electricity generated.
- In Arizona it’s 0.844 lbs per kWh.
313 kWh in California x 0.445 lbs / kWh = 140 lbs CO2.
175 kWh in Arizona x 0.844 lbs / kWh = 147 lbs CO2.
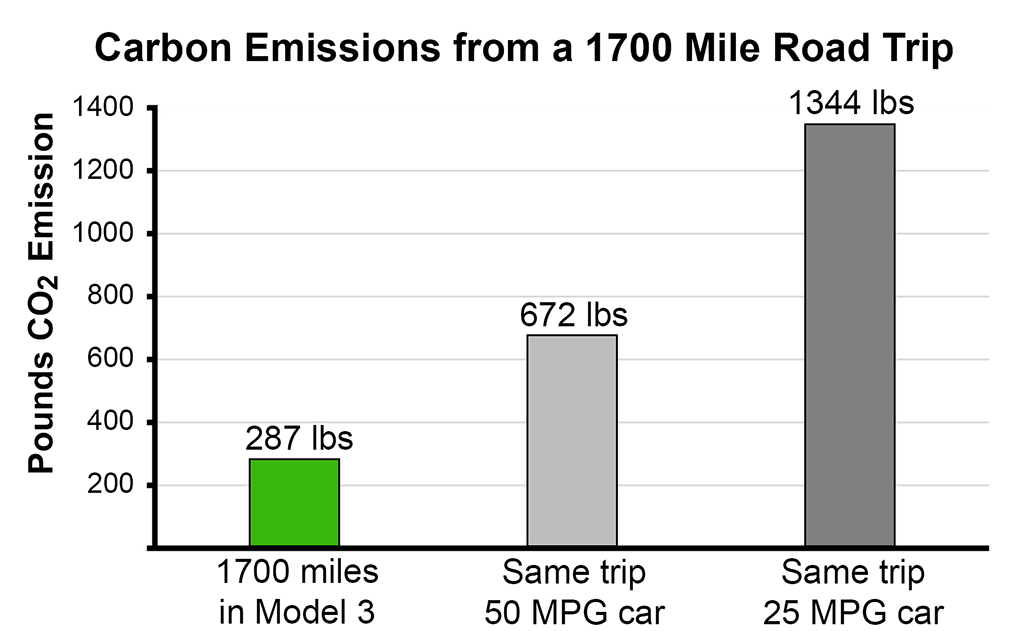
Total emissions from driving electric: 287 lbs CO2.
Compared to Burning Gasoline
How does 287 lbs of CO2 stack up against carbon emissions from driving a gas-burning car? Each gallon of gasoline burned releases 19.6 lbs of CO2 into the atmosphere. So emissions from the tail-pipe of a gas-powered car are determined by efficiency, by how many gallons of gas you burn while driving X miles. In this case we’ll calculate emissions from driving the 1715 miles in a 25 MPG car and a 50 MPG car.
If you drove a 25 MPG car you would burn 68.6 gallons (1715 miles / 25 miles per gallon = 68.6 gallons). If you drove a more efficient car like a Prius getting 50 MPG that would have been reduced to 34.3 gallons.
25 MPG car: 68.6 gallons x 19.6 lbs CO2 / gallon = 1344 lbs CO2.
50 MPG car: 34.3 gallons x 19.6 lbs CO2 / gallon = 672 lbs CO2.
The 287 lbs of CO2 released into the atmosphere from our electric trip were less than half that would be produced by driving a Prius and about 20% of the carbon emissions from driving a 25 MPG car. 287 lbs is not zero, but it’s a good start. If everyone makes the switch to driving electric we will see a huge cut in carbon emissions from the transportation sector, and at this point every bit helps.