
Emissions from producing electricity for the U.S. grid have been steadily dropping. This has resulted from long-term trends of more renewable and cleaner burning sources of energy used to produce electricity. One upshot of this: EVs are cleaner than gas-powered cars, and keep getting cleaner.
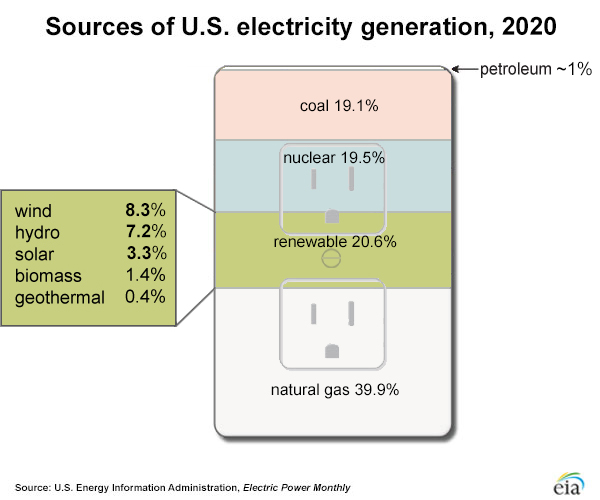
In 2020, renewable sources of electricity production surpassed coal and nuclear energy to account for over 20% of electricity produced in the United States. This news was highlighted over at CleanTechnica. Natural gas remains the largest source at about 40%. The continuing reduction in use of coal, combined with the increased use of cleaner burning natural gas, and increased reliance on renewable sources of energy have made the grid noticeably cleaner on an almost yearly basis.
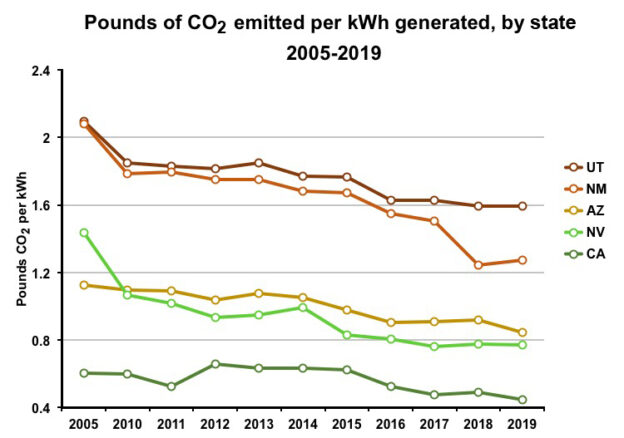
Each region of the country uses different mixtures of energy sources. Some regions use more coal, while other regions use more renewable sources of energy. But improvements in the national grid are visible across the country. The graph below compares carbon emissions from producing electricity in 5 western states: Utah, New Mexico, Arizona, Nevada, and California.
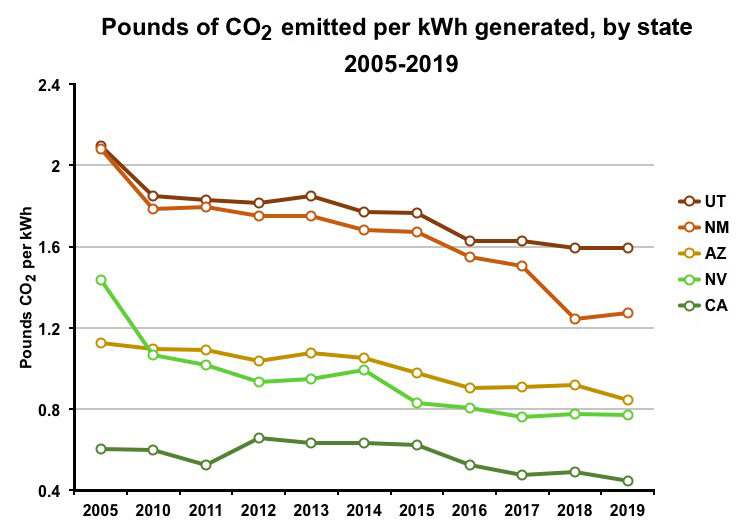
First thing you notice is the different levels of carbon emissions across these states. In 2005, over 2 pounds of CO2 were emitted into the atmosphere for every single kWh generated in Utah and New Mexico. In comparison, 2005 carbon emissions in California were about ⅓ of those in Utah or NM – 0.6 lbs CO2 per kWh. But the good news is in the graph. Utah and New Mexico are now both below 1.6 lbs CO2 per kWh. Arizona, Nevada and California have also decreased emissions. This is progress.
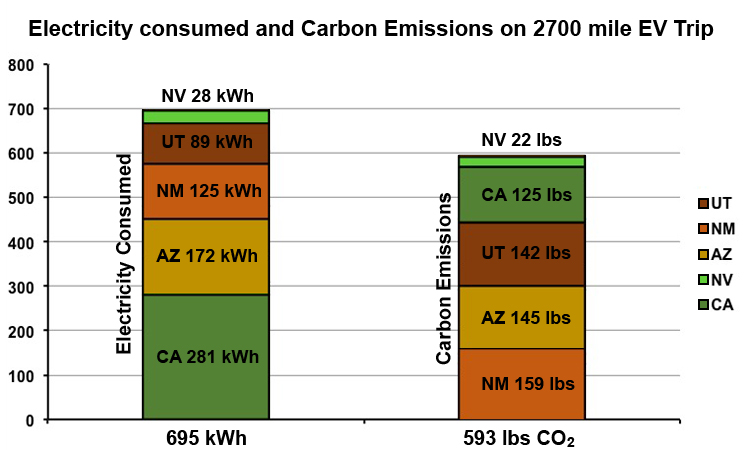
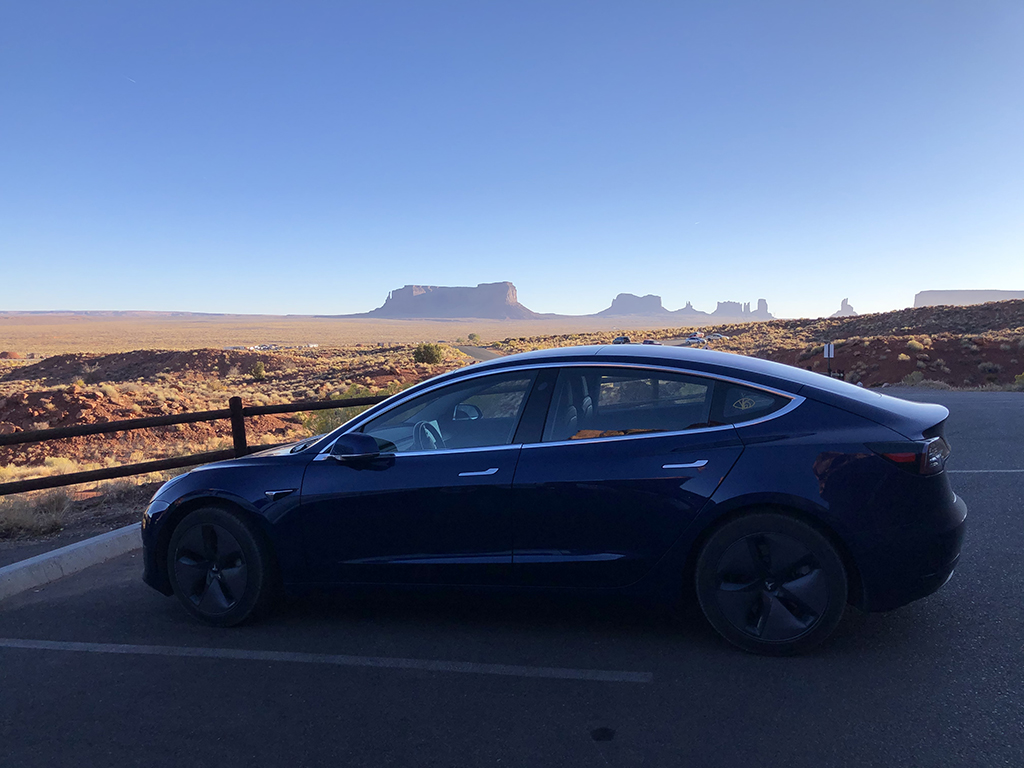
The different carbon emissions across states can also be seen in the real life example shown below. In 2019 I drove from the Sacramento area to Albuquerque and back. 695 kWh were sent to my car while charging in five states on the trip. Since each state has a different energy profile, carbon emissions from each state varied considerably. I obtained the most energy in CA on that trip – 281 kWh – but the largest source of emissions came from New Mexico, where I got only 125 kWh from charging.
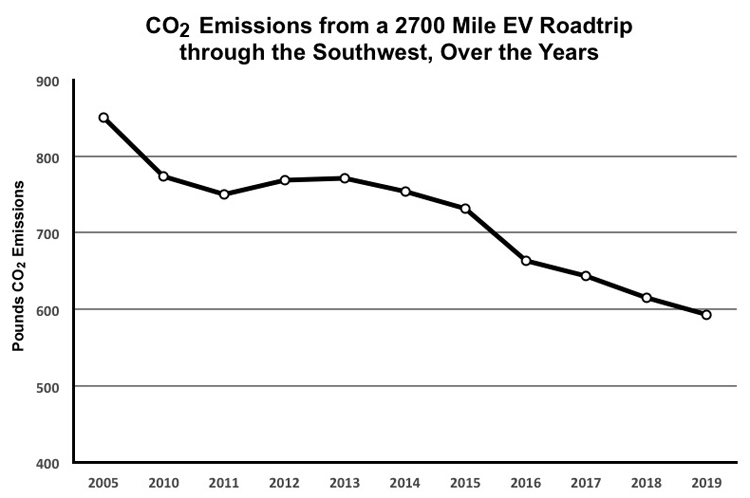
But again, here’s the good news. Emissions are going down in each of these states. And this can be graphed in another way. Imagine I had taken the same trip every year, driving an EV and getting the same number of kWh while charging in the same states. Starting in 2005 my emissions would have been higher: 850 lbs of CO2. But, emissions from this trip would have decreased 30% over 15 years. That’s 250 lbs less CO2 dumped in the atmosphere, for one hypothetical road trip, comparing 2005 to 2019.
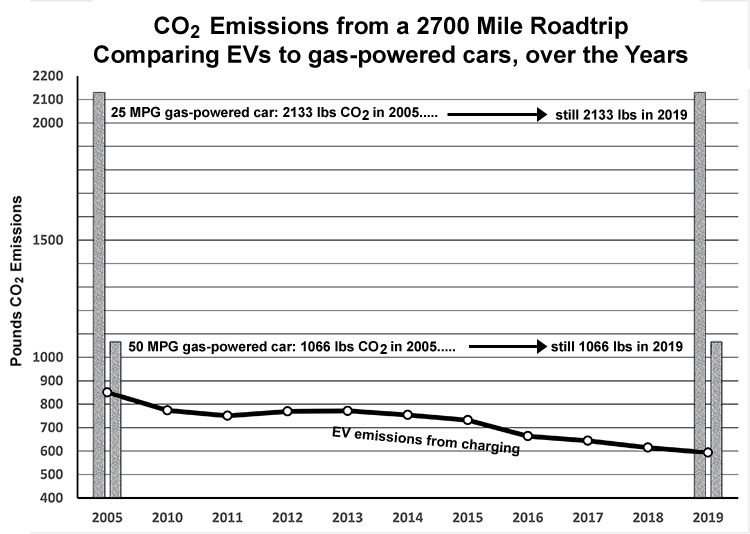
Not to belabor the point, but this doesn’t happen when you buy gas powered cars. If you buy a 29 MPG car today, it’s going to get 29 MPG this year, next year, and the year after that. To highlight this point, I increased the scale of the Y-axis from the graph above so I could plot the carbon emissions of a 25 MPG car on that 2700 mile trip (2133 lbs CO2!!!). It’s a huge difference. Note: that would be 2133 lbs of CO2 in 2005, and 2133 lbs in 2019.
Take home message? Driving an EV is cleaner than driving a gas-powered car, and it keeps getting cleaner. The EV you buy today will likely be cleaner next year, the year after that, and the year after that.
So next time you shop for cars consider an EV. They will get you where you want to go, and can help turn the tide on carbon emissions. Check out Plug-in America’s PlugStar website to see different plug-in models on the market today.
Analysis: Data was obtained from the U.S. Energy Information Administration, a division of the Department of Energy. From their website: “EIA collects, analyzes, and disseminates independent and impartial energy information to promote sound policymaking, efficient markets, and public understanding of energy and its interaction with the economy and the environment.”