

April 2020. California.
Have you wondered how much of a difference it would make for the environment if you started driving electric? This year for Earth Day I analyzed our data from 15 years of driving to compare the carbon emissions produced by the gas-powered and electric cars we’ve owned.
This is an Apples-to-Apples comparison. Emissions were calculated from gallons of gas or kWh of electricity delivered to the cars, and the data come from the same two people driving the same routes in different cars: a gas-powered car, a gas-powered hybrid, and two fully electric cars.
For each car I kept track of mileage and measured energy use by recording the number of gallons of gas pumped into the tank, or electricity delivered to the battery pack from the wall or charging station. Emissions were calculated from energy used. The data show that switching from a 35 MPG car to a gas-powered hybrid, and then switching to electric cars over a 15 year period reduced our carbon emissions by 40% compared to a 35 MPG car. If we could have switched directly from the 35 MPG car to a Model 3 we would have reduced our carbon emissions by 80%.
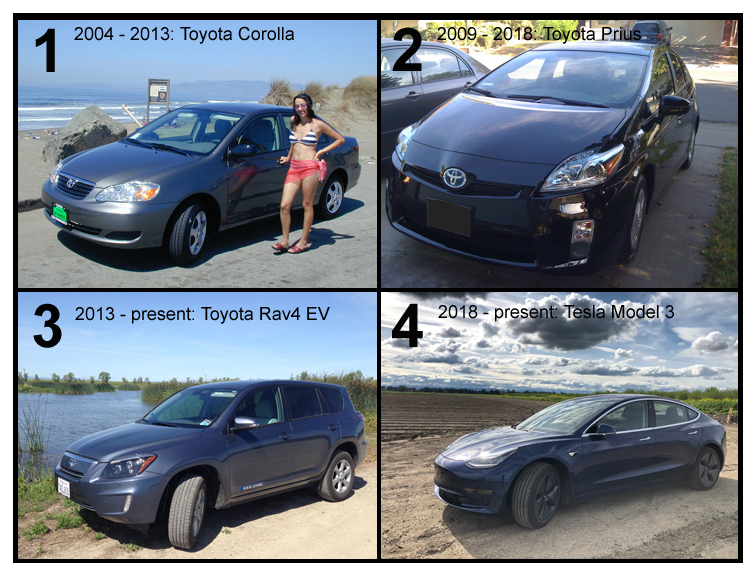
Our cars: We started with a Toyota Corolla in 2004 and drove that car for 9 years. In 2009 we added a gas-powered Toyota Prius to the family as we took new jobs that required more driving. In 2013 we replaced the Corolla with our first electric car – a Toyota Rav4 EV. And in 2018 we replaced the Prius with a Tesla Model 3.

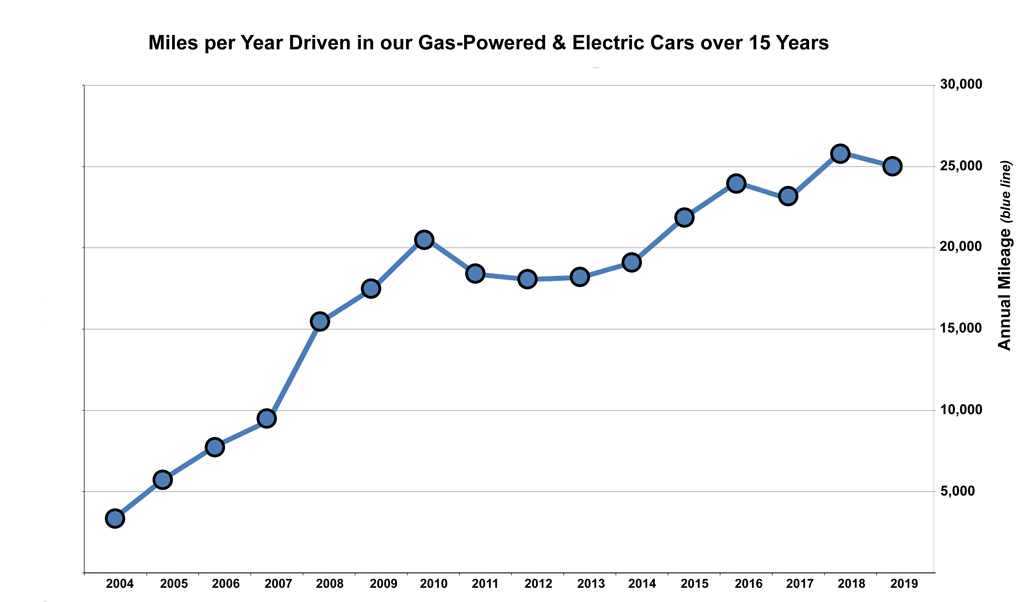
How much did we drive? Our annual mileage data is shown below as a line graph starting in 2004 and stretching through 2019. Each blue circle represents the total number of miles driven by our family in a given year. The blue line shows our trend of driving more miles each year over the 15 years. Miles indicated on the right Y-axis.
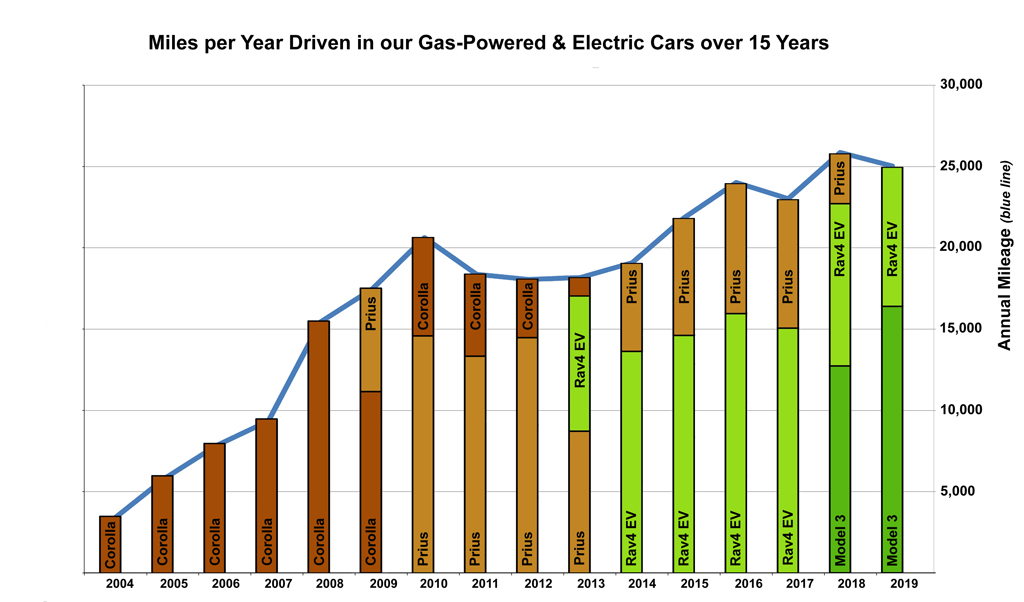
The graph below breaks down our driving by showing the portion of annual miles we drove in each car with colored bars. We started at 3,500 miles per year in 2004 with the Corolla (dark brown), and in 2019 logged 25,000 miles in our Model 3 (dark green) and Rav4 EV (light green).
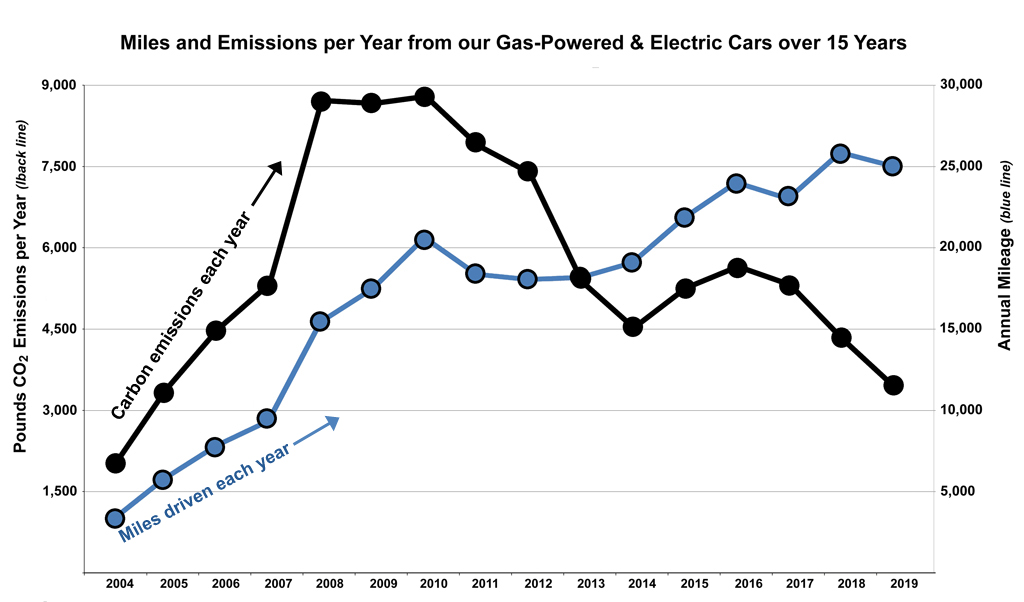
Calculating CO2 emissions for gas-powered cars is straightforward if you know how much gas you purchased: each gallon of gas burned releases about 20 lbs of CO2. I used the U.S. Energy Information Administration figure of 19.6 lbs of CO2 released per gallon of gas burned. Our annual emissions are shown below as the black line graph. Each black circle represents emissions in total pounds of CO2 for a given year. Switching to a gas-powered Prius in 2009 leveled off our emissions curve, and switching to electric cars reduced our emissions. Method for calculating emissions from electric cars is covered at the end of the post.
Comparing Emissions
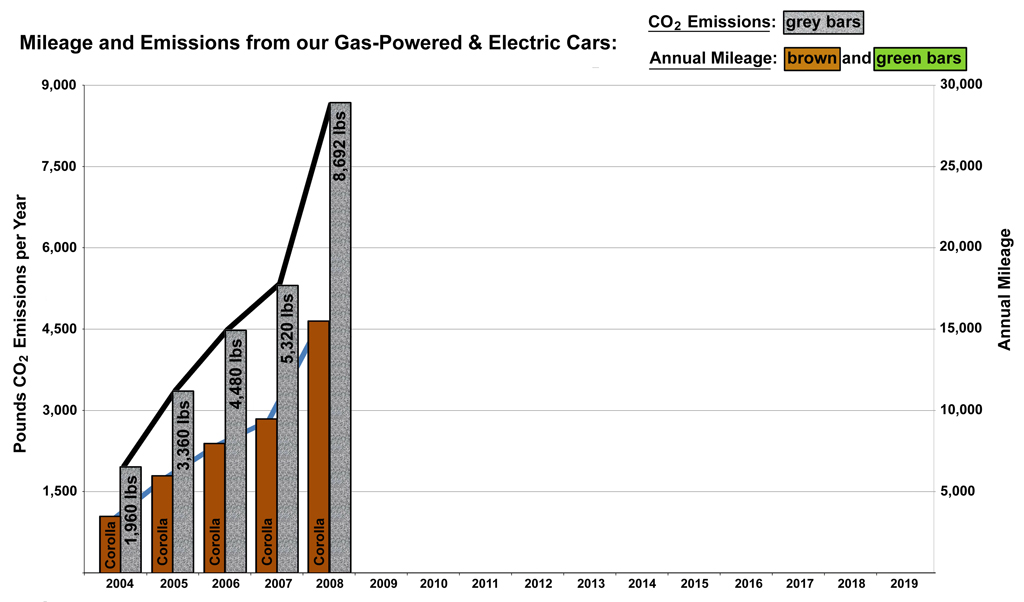
A 35 MPG car produces thousands of pounds of CO2 each year Our annual mileage and carbon emissions from driving the Toyota Corolla from 2004 – 2008 are shown below. Over that span our mileage increased from 3,500 miles a year to 15,000 miles in 2008 (brown bars). As we burned more gas our emissions increased from about 2,000 lbs of CO2 in 2004 to over 8,600 lbs of CO2 in 2008 (grey bars). In 2008, those 8,600 lbs worked out to us releasing 165 lbs of CO2 into the atmosphere every week from driving a 35 MPG car.
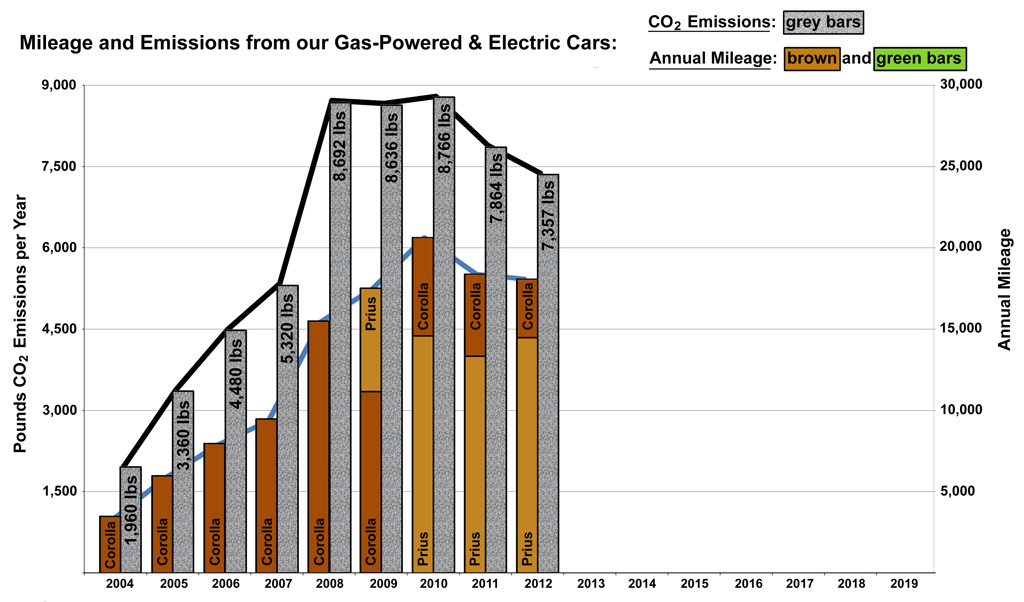
Driving a gas hybrid reduces emissions. In late 2009 we bought a second car, a 2010 Prius that became our primary car. Our annual mileage and emissions from 2009 through 2012 are shown below. Even though our annual mileage increased from 15,000 miles in 2008 to over 20,000 miles in 2010, our annual CO2 emissions stopped increasing. This resulted from driving the 50 MPG Prius more than the 35 MPG Corolla.
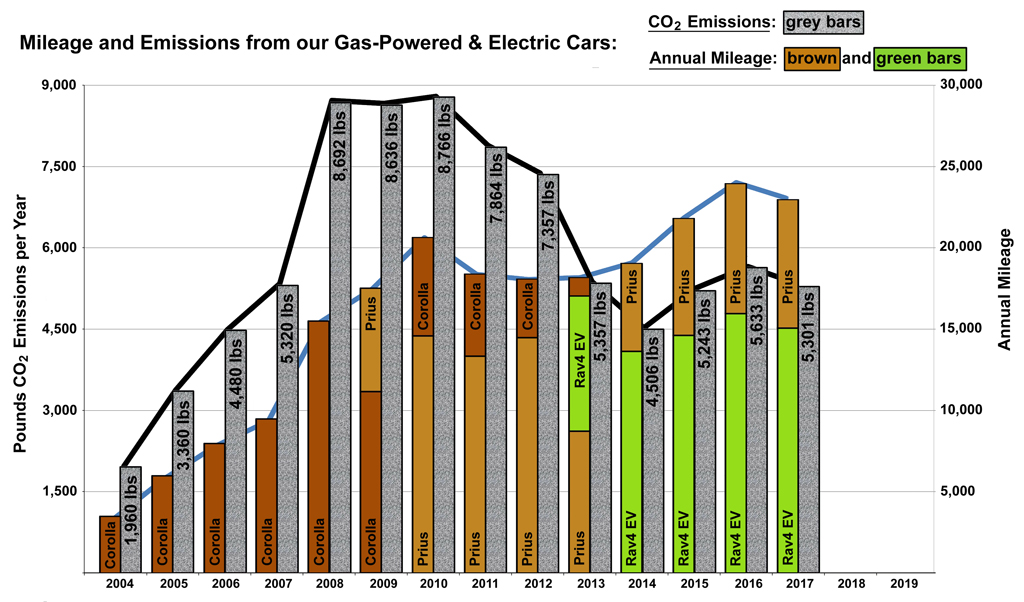
Driving electric reduces emissions even more. In 2013 we bought our first electric car, a 2012 Toyota Rav4 EV, which became our primary car. We used the Rav4 EV for excursions and family trips. Our annual mileage increased to 23,000 miles in 2017. But since we drove the electric Rav4 (light green bars) more often than the Prius, and because electricity in California is far cleaner than gasoline, our emissions dropped from 7,300 lbs of CO2 in 2012 to 5,300 lbs CO2 in 2017 – despite driving more miles.
Going fully electric further reduces emissions. In 2018 we traded in our Prius and bought a Model 3. Since we began driving 2 fully electric cars our annual emissions dropped to 3,400 lbs of CO2 even though our annual mileage increased to 25,000.
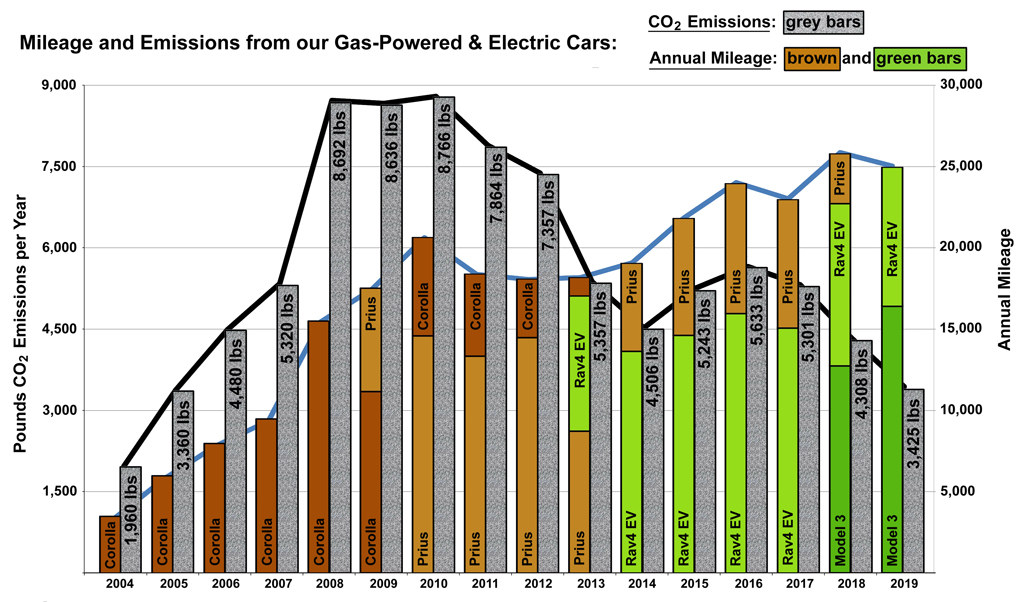
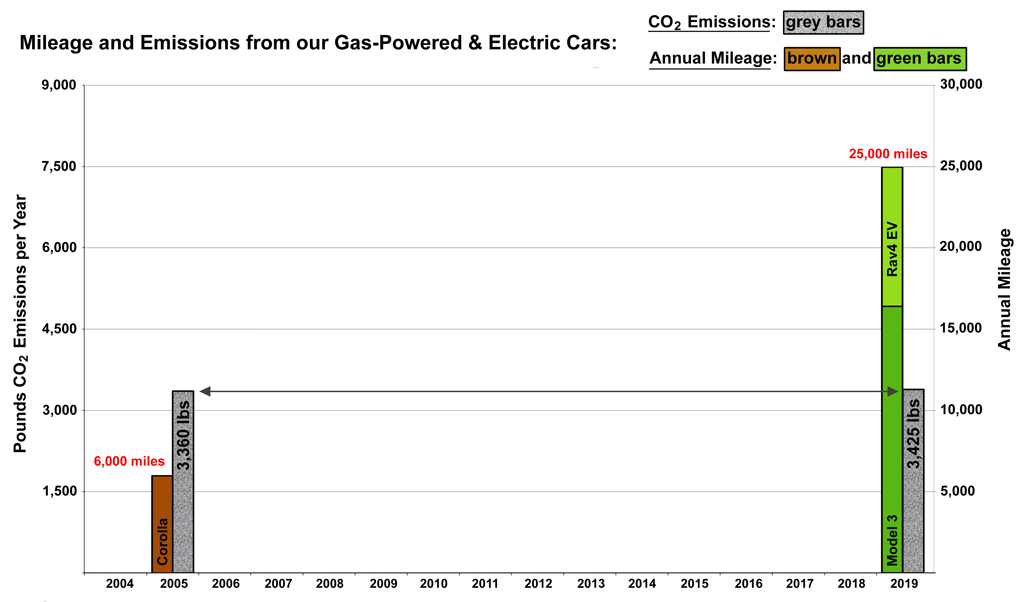
Driving Electric is Way Better than Gas. To drive home the point of how much cleaner it is to drive electric, look at our annual mileage and carbon emissions from 2008 – when we drove the 35 MPG Corolla – and 2019 when we drove 2 electric cars. Driving 6,000 miles in a 35 MPG gas-powered car (brown bar) produced as much CO2 emissions (grey bars) as driving 25,000 miles in electric cars (green bar) in California. Several messages here, one of them: #MakeTheCorollaElectric @Toyota!
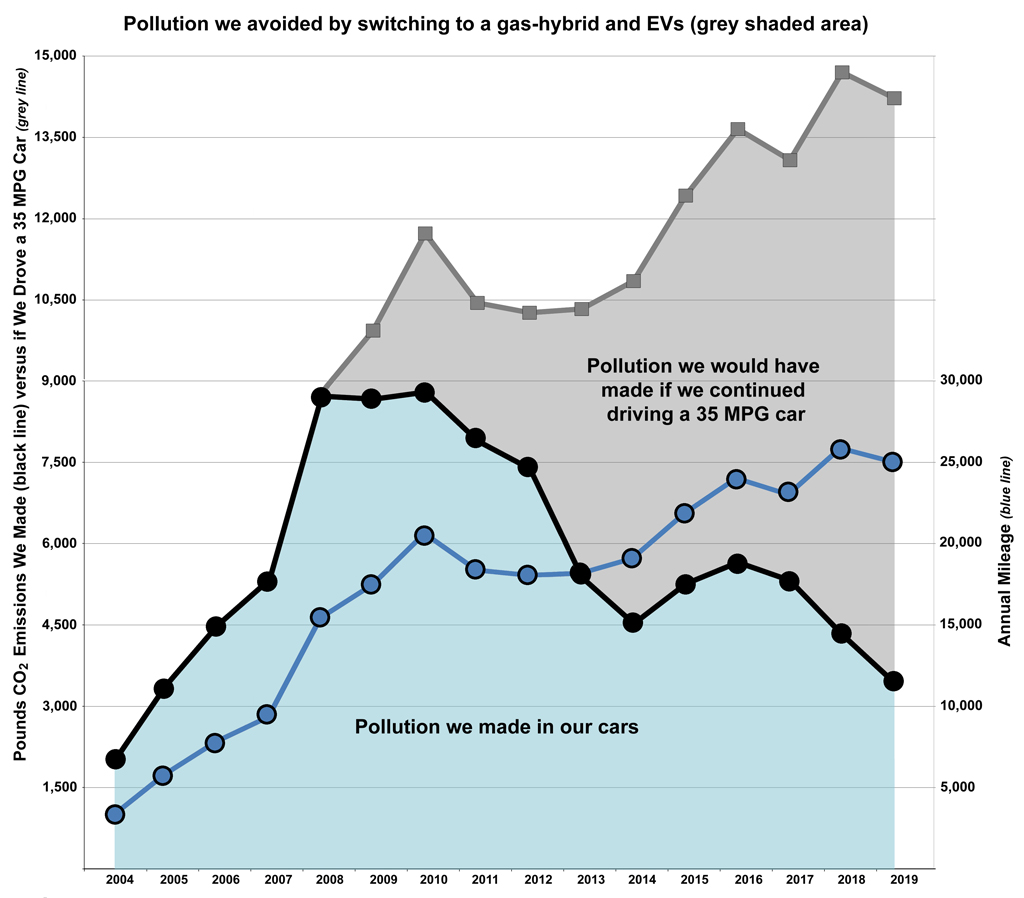
Another way of looking at the data is showing how much pollution we made (blue shaded area below) compared to how much additional pollution we would have made if we had continued driving a 35 MPG car (grey shaded area). In this graph you can see how switching to a hybrid in 2009 helped bend our curve, and that switching to electric cars starting in 2013 really brought down our carbon emissions.
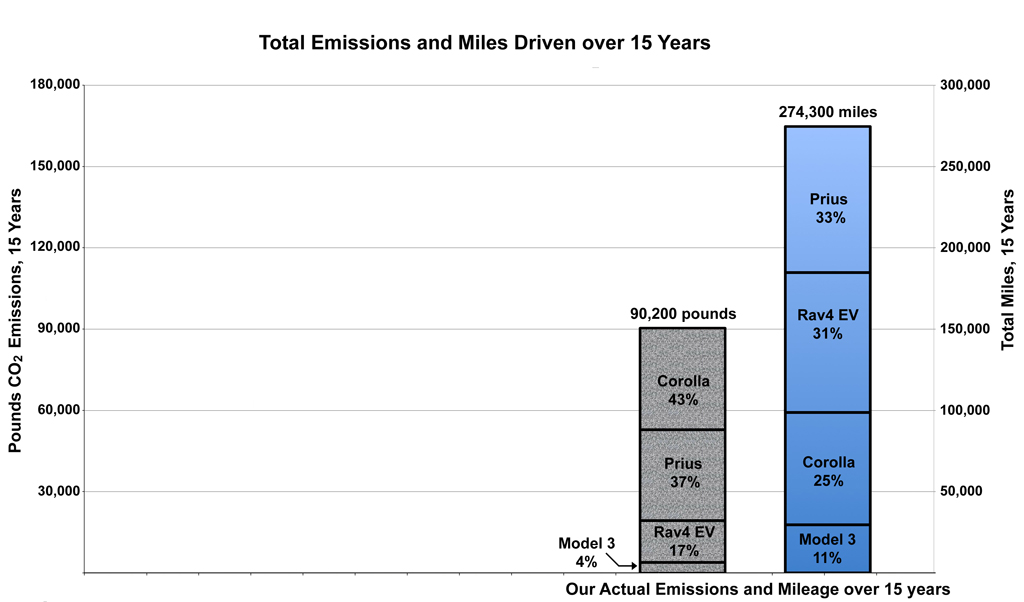
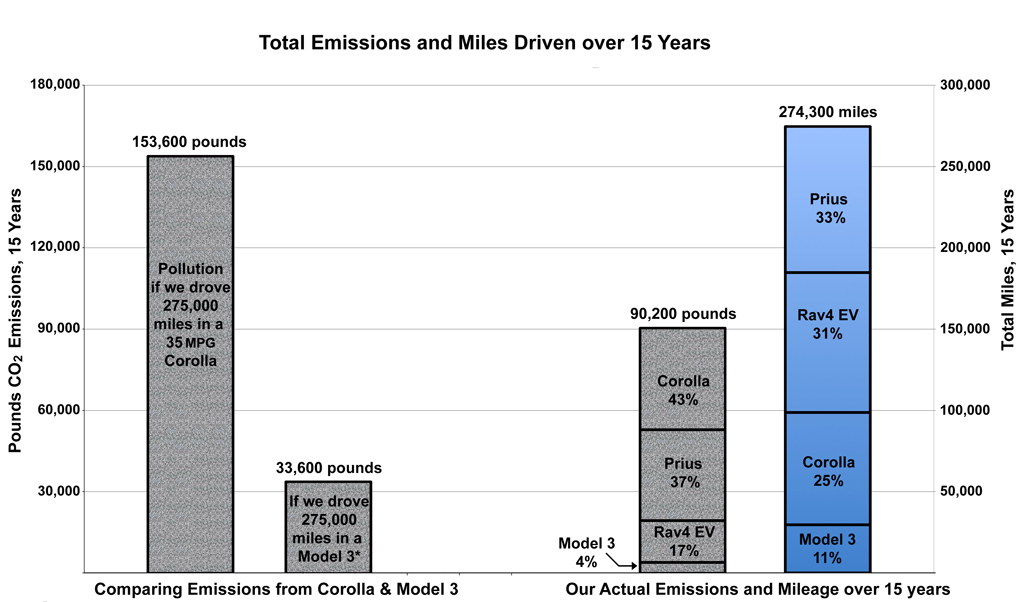
Our Total Mileage and Emissions over 15 Years. The bar graph below shows that the combined total mileage of our 4 cars over 15 years was 275,000 miles (blue bar). We logged 33% of those miles in the Prius; 31% in the Rav4 EV; 25% in the Corolla; and so far 11% of our total miles in the Model 3.
We released over 90,000 pounds of CO2 into the atmosphere from driving over 15 years (grey bar). Although we logged only 25% of our miles in the Corolla, it produced 43% of our emissions since it was our least efficient car. We drove 33% of our miles in the Prius and it produced 37% of our emissions. In contrast, the Rav4 EV logged 31% of our total miles but produced just 17% of our emissions.
The next graph shows that while we produced quite a lot of pollution, it would have been much worse if we had continued driving 35 MPG cars. The grey bar on the left shows that driving 275,000 miles in a car getting 35 MPG would have produced over 150,000 pounds of CO2. We reduced our CO2 emissions by over 60,000 pounds by switching from a 35 MPG car to a gas hybrid and fully electric cars.
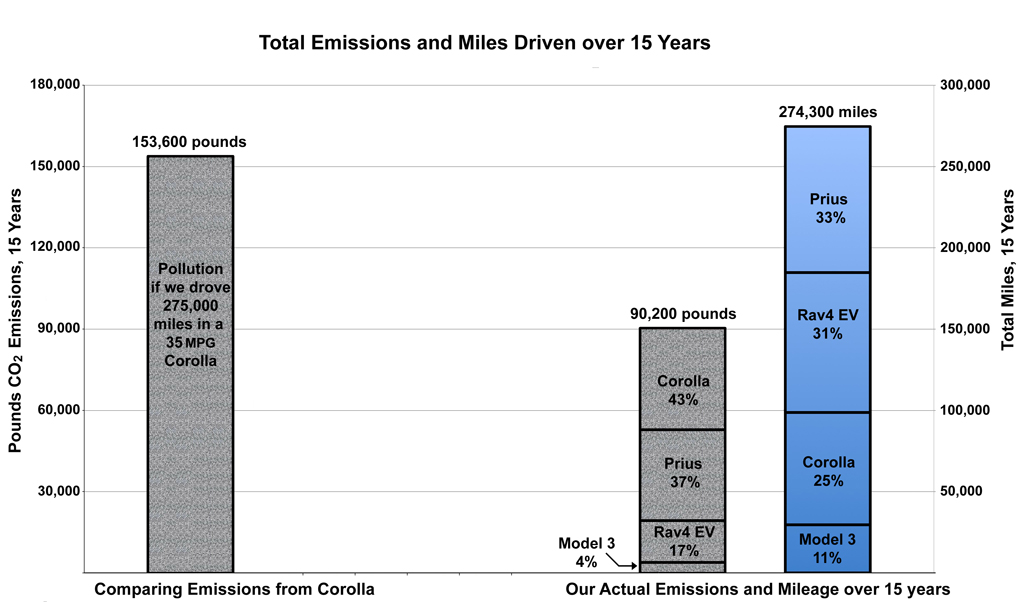
As another comparison, if we had driven all 275,000 miles in a Model 3, our emissions would have been reduced to about 34,000 pounds of CO2.
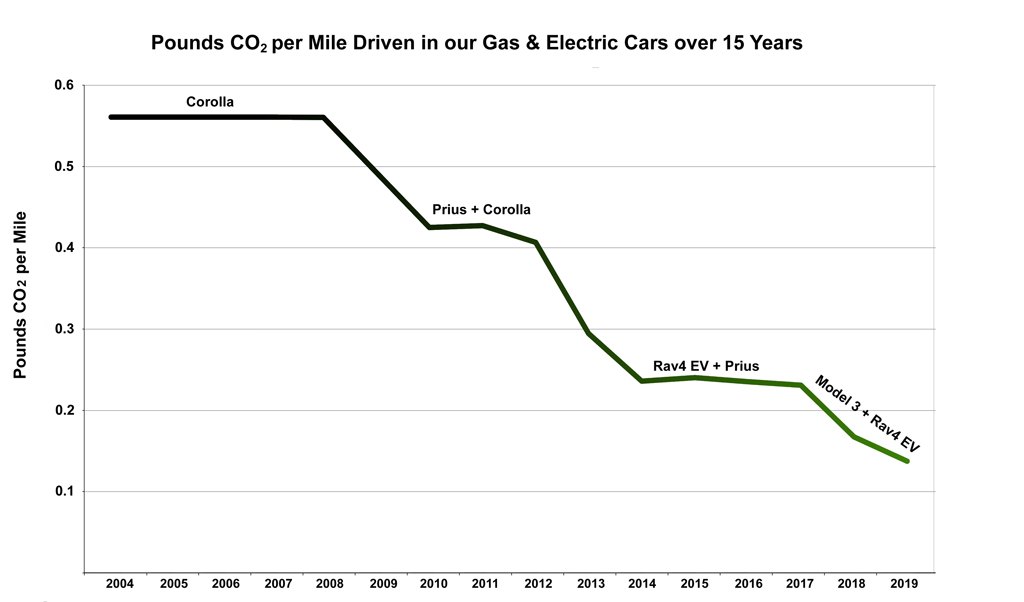
Finally, one last graph to show the amount of CO2 released for each mile driven in our gas powered Corolla and Prius, and our 2 electric cars in California. Driving a 35 MPG car releases over half a pound of CO2 (0.56 lbs) for every mile driven. After buying the Prius the combined emissions of our Prius and Corolla fell to just over 0.4 pounds of CO2 . Our emissions dropped to 0.23 pounds of CO2 per mile when we got traded in the Corolla for the Rav4 EV, and dropped further to 0.13 pounds of CO2 per mile when we traded in the Prius for our second electric car.
Does it make a difference? Yes! Why does this matter? If every family made the switch to gas-powered hybrids, gas-electric hybrids, and fully electric cars we could reduce carbon emissions from personal transportation by hundreds of billions of pounds each year. CO2 emissions are the major green house gas component released by burning gasoline and other fossil fuels, but many other harmful pollutants and particulates are released and should be reduced as much as possible, as soon as possible.

Renewables Reduce your Carbon Footprint
Renewables reduce carbon emissions. It’s worth stating the obvious because clean air means better health. California obtains a significant portion of it’s electricity from renewable sources: in 2018 over 30% from solar, wind and large hydroelectric power. This makes the air cleaner to breathe, and makes driving electric cleaner. In addition, our 6.2 kW rooftop solar power system offsets all the electricity we use in our home and for charging our Model 3. The data I presented above ignores our solar offset, and was calculated as if we received all of our electricity from our California utility. But, in 2018 and 2019 our effective carbon footprint was lower.

Each state produces electricity from a different mix of Natural Gas, Nuclear, Renewables, and/or Coal powered plants, which impacts emissions in your region. You can find data on your state’s energy profile and emissions here and here.
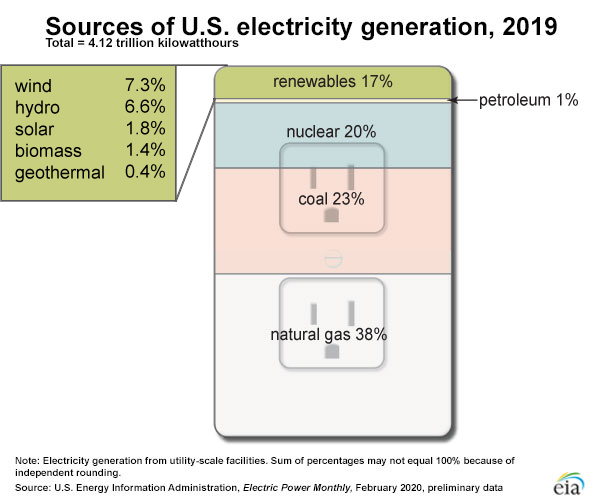
The amount of renewable energy used to produce electricity across the United States has been steadily rising. In 2019, 17% of US electricity was produced from renewable sources, 23% from coal, and 38% from natural gas. The large scale switch from coal to cleaner burning natural gas is reducing carbon emissions, but we still have a ways to go.
Calculations:
Gallons of Gas Burned: This whole super interesting post </s> was possible because while tracking home finances I noticed that gas station receipts included the number of gallons purchased down to the thousandths (e.g.: 9.849 gallons). From there I recorded gallons used, MPGs, and emissions for the Corolla and Prius.
Emissions from Gasoline: Burning a gallon of gas produces 19.6 pounds of CO2.
Electricity Consumed by our EVs: I keep track of kWh usage from the battery pack for our electric cars, and calculate energy use from the wall using common efficiency standards to estimate total kWh delivered to the cars: Level 2 charging (240V): 85% efficient; Level 1 charging (120V): 70% efficient. For DC charging our Rav4 EV and Supercharging our Model 3 I used data from EVgo and Tesla on number of kWh delivered to the car during charging sessions.
Emissions from Electricity Generation: With total kWh in hand, I used data on carbon emissions produced by electricity generation in my state, each year, from the United States Energy Information Administration. 2018 state by state profiles are found here. Once you select a given state you can also select specific years to look at carbon emissions over time.
Summary Points:
- Driving electric reduces emissions: Rav4 EV and Model 3 emissions in California are ¼ of the CO2 produced by a 35 MPG car, and ⅕ of a 25 MPG car.
- Each state uses a different mix of Natural Gas, Nuclear, Solar, Wind, Hydroelectric, Geothermal, Coal, etc., to produce electricity. Find data about your state here, here, or from many other sources.
- Unless you obtain your electricity from 100% renewable sources, driving electric produces carbon emissions. BUT far fewer emissions than a typical 25 MPG gas powered car.
- The electric grid is interconnected. Electricity crosses state lines. e.g.: While CA does not have coal burning power plants it may import some electricity that was generated by burning coal.
- The electric grid gets cleaner every year.
- Buy electricity from renewable sources. Many utilities offer customers options to purchase energy supplied from renewable generation.
- Ride a Bike, walk, take public transit if possible.
- Every Day is Earth Day.